

Improve your website’s performance using Google Analytics. This important tool lets you gather data that shows key measurements, such as the number of users and sessions, assisting you in making well-informed choices. This guide will show you how to make an account, set up a property, and use Google Analytics to improve your online plan. Use analytics to improve your online success!
Key Takeaways:
- Google Analytics is a powerful web analytics tool that helps track and analyze website traffic to improve online business performance.
- Some key metrics to pay attention to in Google Analytics include sessions, users, bounce rate, and conversion rate.
- To get started, set up Set up a Google Analytics account, property, and tracking code. Then, set goals, create custom dashboards, and apply filters to make the most of the tool.
Contents
- Understanding Key Metrics
- Setting Up Google Analytics
- Configuring Google Analytics
- Analyzing Data in Google Analytics
- Frequently Asked Questions
- 1. What is Google Analytics and why is it important?
- 2. What are the key metrics in Google Analytics?
- 3. How do I set up Google Analytics for my website?
- 4. Can I use Google Analytics for e-commerce tracking?
- 5. How often should I check my Google Analytics data?
- 6. Can I use Google Analytics for mobile apps?
1. What is Google Analytics?
Google Analytics is a powerful tool that gathers information about how people use websites and apps, offering data through measurements and categories. This platform primarily tracks user behavior by monitoring key metrics such as sessions, bounce rate, and average session duration.
For example, by analyzing the bounce rate, you can identify pages that might need optimization to retain visitors. Tracking conversions helps you measure how well users complete tasks you want them to, such as submitting a form or buying something.
Using Google Tag Manager improves your ability to track by allowing you to manage and add marketing tags without changing the code, enabling smooth data collection for your campaigns.
2. Importance of Google Analytics
Knowing how users behave is essential for improving marketing plans, and Google Analytics offers useful information that can help attract and keep users.
By analyzing metrics like user sessions, bounce rates, and conversion funnels, businesses can pinpoint effective channels and content.
For instance, if data indicates that 60% of visitors leave the site after looking at only one page, companies can make their landing pages better or improve internal links. Dividing users based on age or actions helps create more specific marketing campaigns.
UTM parameters help monitor how well particular campaigns perform, showing which strategies bring the best return on investment. I recently came across this fascinating analysis of cloud data warehouses that challenges conventional wisdom on data management and performance tracking.
Understanding Key Metrics
Knowing key numbers in Google Analytics is important for any marketer because they reveal user interactions with the website and indicate how well the site is doing. To enhance your understanding, it’s beneficial to develop a comprehensive framework, such as creating a topical map for your website, which can help in organizing and optimizing your content strategy effectively.
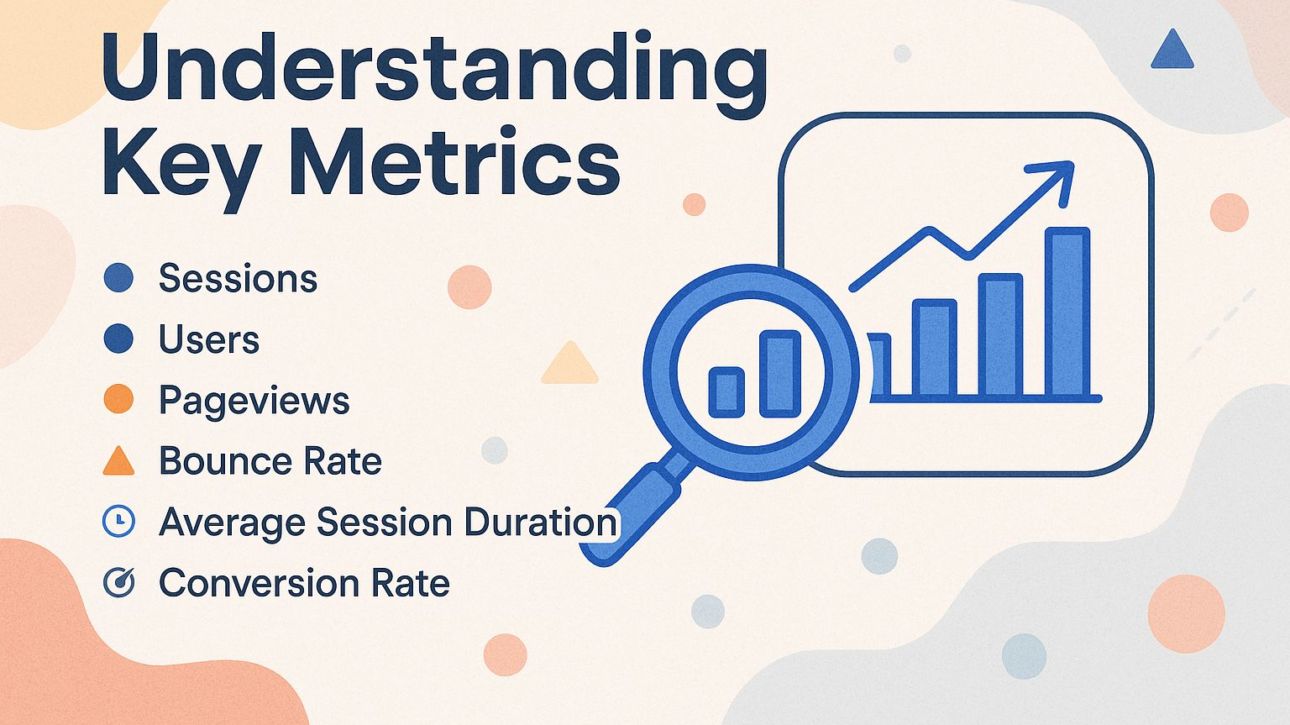
1. Sessions
A session is defined as a group of user interactions with your website that occur within a given time frame, typically 30 minutes.
Each time a user visits your site and engages with it-whether by viewing pages, clicking buttons, or completing forms-it contributes to a session. If a user remains inactive for 30 minutes, that session ends.
Monitoring the number of sessions, along with metrics like session duration and bounce rate, is essential for evaluating user engagement. Tools like Google Analytics provide statistics that show which content is successful and where users stop engaging, helping you improve your strategy.
2. Users
The ‘Users’ metric shows how many individual visitors there are. It gives information about the number of new users and how often returning users interact.
Looking at these numbers can improve your marketing plans. For instance, if new users consistently outnumber returning ones, consider creating loyalty programs or engaging content to encourage repeat visits.
Tools like Google Analytics can segment users, allowing you to identify behavior patterns more easily. Sending customized emails based on what users do can make them come back more often, and trying different landing pages can help get more new users to sign up.
By strategically addressing the needs of both segments, you can create a more effective user experience overall.
3. Pageviews
Pageviews track how often a page is opened, providing a basic measure of website performance and how users interact with it.
Looking at pageview data can show patterns in how users act, pointing out which content connects best with your audience.
Google Analytics provides information such as the number of times a page is viewed, the percentage of visitors who leave after viewing one page, and the typical length of time a visitor spends on the site.
By examining these figures, you might notice that blog posts about industry trends garner double the pageviews compared to product updates. This information can help you plan your content by focusing on popular subjects to increase interaction or by updating pages that are not doing well. Looking at this data often helps make content more focused.
4. Bounce Rate
Bounce rate is the percentage of people who leave the website after looking at just one page, showing how relevant the content is.
To interpret bounce rates effectively, consider the average for your industry-higher than 70% may signal a problem.
To lower bounce rates, implement engaging content strategies such as enhancing site speed, ensuring mobile optimization, and utilizing clear calls-to-action. Consider A/B testing different landing pages to see which design keeps visitors engaged.
Adding interactive features such as quizzes or videos can motivate users to look around more, creating a better experience that keeps them on your site longer.
5. Average Session Duration
Average session duration shows how long people usually stay on your site, helping you see how well your content works and how interested users are.
A longer average session duration indicates better user engagement. To make this metric better, concentrate on producing content that connects with your audience.
For example, use interesting images or charts to make the text easier to understand. Improve how users move around the site to lower the number of people leaving quickly; tools like Google Analytics can find troublesome spots.
Use internal links to guide users to visit additional pages. These practical measures can greatly increase user engagement and extend session length.
6. Conversion Rate
Conversion rate, the percentage of visitors who finish a wanted task, is an important measure for evaluating how well marketing strategies work.
Improving your conversion rate requires a data-driven approach. Start by analyzing your current conversion metrics using tools like Google Analytics or Hotjar to identify drop-off points.
Implement A/B testing on call-to-action buttons, such as changing the color or wording, to see which version drives more clicks.
Improve the user experience by simplifying forms or speeding up page loading times; even a one-second delay can reduce the number of users who finish tasks. By concentrating on these areas, you can design an experience that motivates visitors to act.
Setting Up Google Analytics
Getting Google Analytics up and running is important for gathering and examining data properly. Create your account and input your property details.
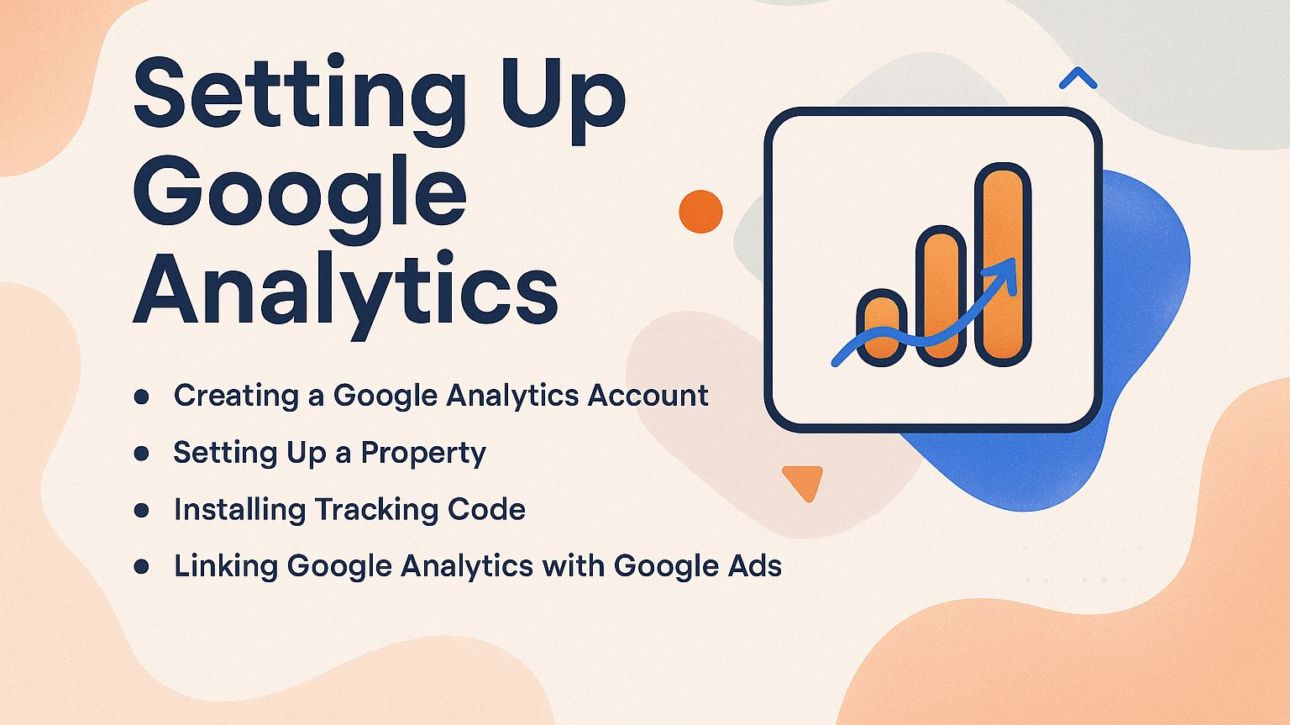
1. Creating a Google Analytics Account
To begin with Google Analytics, go to analytics.google.com and follow the instructions to set up your account.
After initial setup, choose an account name that reflects your business for easy identification. Next, set up a property, which is often your website or app, specifying its name and URL.
It’s beneficial to structure your accounts hierarchically; for instance, you might create an overarching account for your business and separate properties for each product line.
Make sure to turn on data sharing settings based on what you want early to improve your analytics experience. Implement the tracking code on your website, ensuring you monitor user engagement effectively.
2. Setting Up a Property
Creating a property in Google Analytics lets you gather details from your website or app by adding data streams for exact monitoring.
To begin, set up a property in Google Analytics and go to the ‘Data Streams’ section. You’ll choose between Web, iOS, or Android streams based on where your data comes from.
For websites, input your URL and name the stream to clearly identify it later. For apps, choose your platform and follow the steps to install the tracking code or SDK.
Each stream gives important information-such as details about who your users are and how they act-that helps you adjust your marketing plans effectively.
3. Installing Tracking Code
Installing the Google Analytics tracking code is essential for collecting data on user interactions, and it can be implemented in various ways depending on your setup.
An easy way is to copy the tracking code from your Google Analytics account. Go to Admin, choose the right property, and click on Tracking Info, then Tracking Code.
Copy the script provided and paste it into the header section of your website’s HTML. If you’re using Google Tag Manager, create a new tag and select ‘Google Analytics: Universal Analytics.’
Paste the tracking ID, configure the trigger to fire on all pages, and publish your container. This allows for easier updates and better organization of your tags.
4. Linking Google Analytics with Google Ads
Connecting Google Analytics with Google Ads improves your ability to assess ad performance and track user acquisition with detailed reports.
To link Google Analytics with Google Ads, first, sign in to your Google Analytics account.
Go to ‘Admin,’ find ‘Google Ads Linking’ in the ‘Property’ column, pick the Google Ads account you want to connect, and click ‘Continue.’
Next, turn on the Auto-Tagging option if it’s not already active, as this helps with accurate tracking. Save your changes. This integration gives helpful information, like how well your ad campaigns are doing and what actions your users take after clicking on your ads, which helps improve your marketing plans.
Configuring Google Analytics
Once installed, changing Google Analytics settings is essential to make the platform fit your needs and goals, helping you understand your data better. For businesses eager to enhance their data strategies, integrating Google Analytics with a cloud data warehouse can provide a comprehensive view of your analytics and streamline data management.
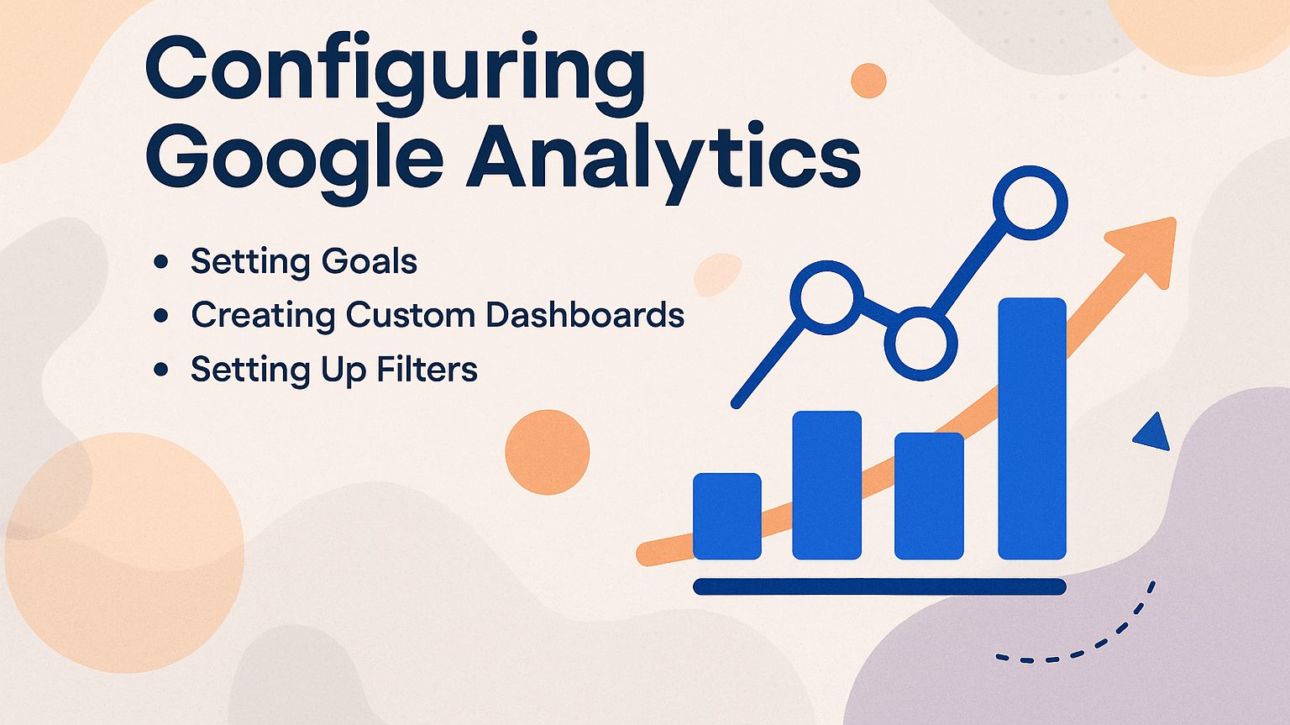
1. Setting Goals
Setting specific goals in Google Analytics enables you to measure user engagement and conversion metrics effectively, ensuring alignment with business objectives.
Go to the Admin area of your Google Analytics account, pick the view you want from ‘View Settings,’ then press ‘Goals’ to set and monitor targets. Here, you can set new goals that match what you want to achieve. Consider types like:
- Destination (tracking landing pages)
- Duration (monitoring session length)
- Pages/Screens per session (assessing content engagement)
- Event (capturing specific user interactions)
For example, if you run an e-commerce site, a Destination goal could track successful purchases, while an Event goal might measure newsletter sign-ups. Look at these metrics often to improve your marketing strategies.
2. Creating Custom Dashboards
Custom dashboards in Google Analytics let you see the key metrics quickly, set up to fit your specific business needs.
To create an effective custom dashboard, start by identifying your key performance indicators (KPIs). For example, choose metrics like ‘Sessions’, ‘Bounce Rate’, and ‘Goal Completions’ to track user engagement.
Next, go to the ‘Customization’ section in Google Analytics and choose ‘Dashboards’. Here, you can either create a new dashboard or add widgets to an existing one. Use ‘Scorecards’ to see quick measurements and ‘Time Series’ graphs to follow changes over time.
Remember to regularly review and adjust your dashboard to reflect any changes in your business priorities.
3. Setting Up Filters
Setting up filters in Google Analytics helps you improve data collection, so you can focus on important information while leaving out unnecessary traffic.
To set up useful filters, go to the Admin panel, choose the correct View, and click on ‘Filters.’
Common examples include:
- Exclude Internal Traffic: Use the IP address filter to block your internal team’s visits.
- Lowercase URLs: Implement a filter to make all URL requests lowercase, ensuring consistency in tracking.
- Specific Subdirectory: Focus on just a segment of your site, like `/blog`, using an include filter for detailed analysis.
These filters check the data for accuracy and improve its usefulness.
Analyzing Data in Google Analytics
Checking details in Google Analytics helps you understand user behavior on your site, which aids in improving the website based on data.
For those interested in expanding their knowledge beyond analytics, you might want to explore how Google Search Console complements these insights by providing additional data on search performance and user engagement metrics. See also: What is Google Search Console: Features, Setup Guide, and How to Use It
1. Accessing Reports
Viewing reports in Google Analytics gives you a full look at how users engage with your site, helping you understand how well your website is doing.
To use Google Analytics, first log in to your account. Go to the left sidebar and select `Audience’ to understand who your visitors are; this includes demographic data and interests. Next, click on `Acquisition’ to view how visitors arrived at your site, including details like organic search or social media.
Check the `Behavior’ report to analyze user engagement on your pages, including page views and bounce rates. This approach allows you to tailor your content and marketing strategies effectively.
2. Understanding Audience Reports
Audience reports in Google Analytics reveal critical demographics and behavior patterns of your users, informing targeted marketing strategies. These reports contain information like age, gender, and interests, which show who your audience is and their engagement with your content.
For example, if you notice a high percentage of users aged 18-24, consider tailoring your campaigns to platforms favored by this demographic, like Instagram or TikTok.
In the same way, looking at what topics your audience is interested in can help you decide what content to make. Creating tech articles or videos can engage people who enjoy technology. Regularly checking these measurements helps improve your marketing strategy.
3. Traffic Sources
Traffic sources reporting in Google Analytics helps identify where your users are coming from, allowing for a targeted approach to marketing efforts.
Go to Acquisition > All Traffic > Channels to view traffic source reports. You’ll see categories like Organic Search, Direct, Referral, and Social.
Analyzing these allows you to pinpoint strengths and weaknesses. For instance, if Organic Search is strong but Social is weak, consider enhancing your social media strategy.
UTM parameters help track specific campaigns, showing which platforms effectively drive traffic. Regularly check these reports to change your approach and make the most of effective channels.
4. Behavior Flow
The behavior flow report visualizes the paths users take through your site, highlighting areas of engagement and potential drop-off points.
To improve user experience, review the report by finding the main areas where users spend the most time. For instance, if you notice high traffic on a specific product page but a steep drop-off at checkout, consider simplifying the checkout process or integrating a prominent call-to-action.
Check this report often, paying attention to how users move through the site on various devices. Tools like Google Analytics can help track these behaviors and give information to improve content layout and make user paths better.
Frequently Asked Questions
1. What is Google Analytics and why is it important?
Google Analytics is a free web analytics tool provided by Google that allows website owners to track and analyze their website traffic. It offers useful information about user actions, conversion rates, and other important numbers that help companies make decisions based on data to better their online visibility and reach their objectives.
2. What are the key metrics in Google Analytics?
Some of the key metrics in Google Analytics include sessions, page views, bounce rate, average session duration, traffic sources, and conversion rates. These metrics give helpful details about your website’s performance and help you learn more about your audience.
3. How do I set up Google Analytics for my website?
To set up Google Analytics for your website, you first need to create a Google Analytics account and add your website as a property. Next, you will need to add the tracking code to your website’s HTML code. Once the tracking code is installed, Google Analytics will start collecting data from your website.
4. Can I use Google Analytics for e-commerce tracking?
Yes, Google Analytics offers an e-commerce tracking feature that allows you to track sales and revenue on your website. You can set up e-commerce tracking by enabling it in your Google Analytics account and adding the necessary code to your website’s checkout pages.
5. How often should I check my Google Analytics data?
The frequency of checking your Google Analytics data depends on your website’s traffic and your business goals. Check your data at least once a week to stay updated on changes and make decisions based on facts quickly.
6. Can I use Google Analytics for mobile apps?
Yes, Google Analytics also offers mobile app tracking that allows you to track user behavior and in-app events. You can set up mobile app tracking by creating a mobile app property in your Google Analytics account and integrating the tracking SDK into your mobile app.